Looking for our dealer site? Visit Jack Hunt Coin Broker »
Make an Appointment: (716) 874-7777 | Contact Us
View historical precious metals price charts »
View historical precious metals price charts »
- September 29, 2022 -
By Lisa Murray-Roselli
The gold-silver ratio is the relationship between the price of gold and silver, expressed as the number of ounces of silver required to equal the value of one ounce of gold. As of this writing, the ratio is 85.6:1. The ratio tends to be a reliable barometer for global economic, social, and political stability and, therefore, a valuable tool for investors.
This ratio is the oldest, continuously tracked exchange rate in history. In the beginning, it was set by governments for monetary stability, but since the middle of the 20th century and the abandonment of the gold standard, it has fluctuated with the market.
The earliest record of a standard gold-silver ratio comes from Menes, the first king of ancient Egypt, who set the ratio at 2.5:1 in 3200 BCE. Following that, there are records from ancient Rome, where the ratio was set at 8:1 in 210 BCE and by Julius Caesar at 11.5:1 in 46 BCE. In the Common Era, records show the ratio at 14.2:1 in 1305, 12:1 in the 1450s, and finally 15:1 as the US government fixed the rate of exchange with the Coinage Act of 1792.
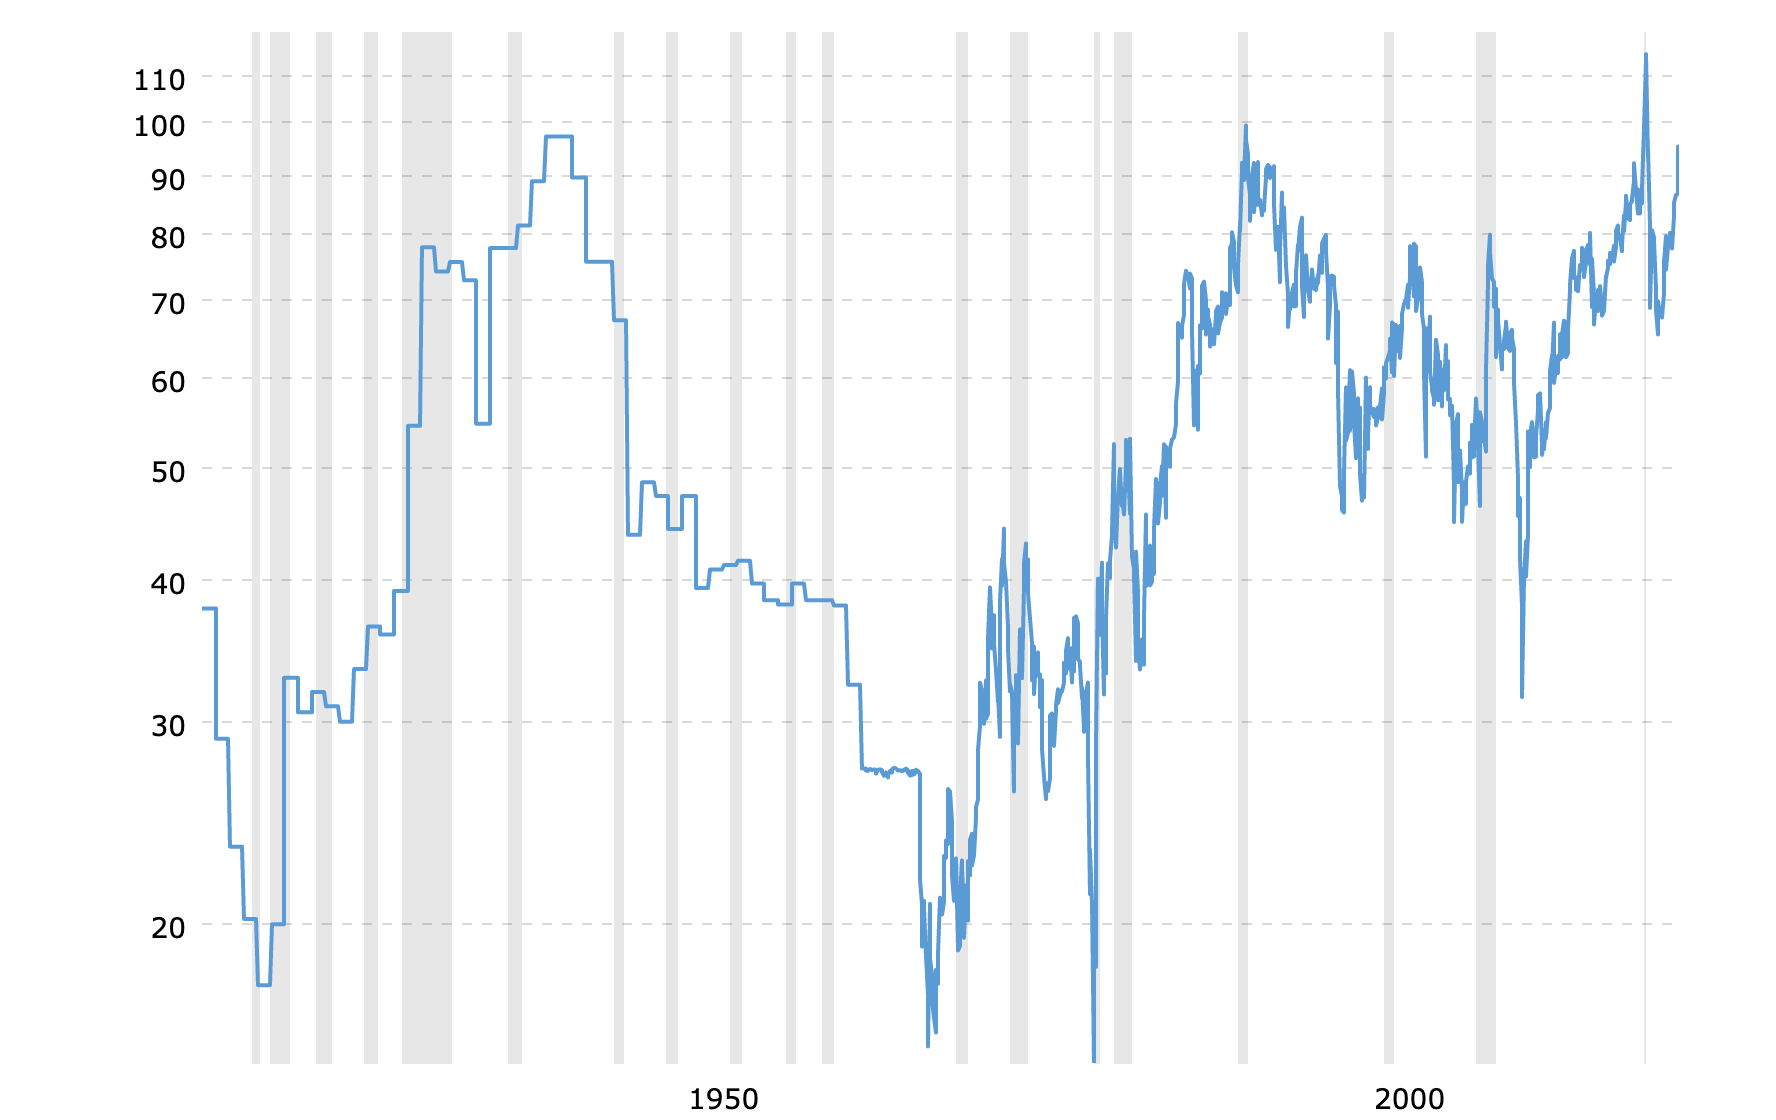
Throughout the 20th century, there was greater volatility in the ratio. President Roosevelt set the price of gold at $35/ounce in 1934 and the ratio climbed to 98:1 in 1939. After the post-WWII Breton Woods Agreement of 1944, which fixed foreign exchange rates to the price of gold, the ratio declined. As the gold standard was cast aside in the 1960s and 1970s, it declined further, to about 16:1.
The 1980s and early 1990s, however, brought a sharp rise in the ratio, peaking at 100:1 in 1991. Just before that peak, silver prices had declined, Iraq invaded Kuwait (driving up the price of oil and destabilizing global politics), and consumer confidence dropped as a recession pummeled the economy. With subsequent economic and political stabilization, the ratio once again decreased—from 1998-2018, the average ratio was 60:1. And then came the pandemic. The SARS-CoV-2 onslaught disrupted nearly every industry one can name, including precious metals.
In April of 2020, the gold-silver ratio reached a historic zenith of 125:1. Everything everywhere was topsy-turvy, and investors latched onto their go-to safety net: gold. Prices shot up for gold but not for silver, creating this enormous chasm. As the economy began to steady and society was better able to handle the pandemic, the ratio also steadied, once again proving that it acts as a barometer of economic, social, and political stability.
The gold-silver ratio generally expands during the most difficult days of an economic crisis or leading up to a significant correction in equity markets. During an economic downturn, gold is favored by investors, driving up prices. A high ratio can also be a harbinger for turbulent times ahead. In addition to the 1991 and 2020 aberrations, spikes happened leading up to the Black Monday stock market crash in 1987 and in 2018 when silver prices fell, partly owing to a weakness in industrial base metals—more than half of silver production is for industrial use. The ratio hit an extraordinarily low in 2011 when silver prices were at record highs of nearly $50/ounce, driving the ratio to 34.7:1. The economy was emerging from aa financial crisis and a strengthening solar power industry caused a surge in demand for silver, which would be used in PV solar cells.
In addition to providing insight into the state of the markets, and the economy more broadly, experts say that the ratio can be used to understand how gold and silver are performing in the market and as an indicator for when to buy and sell. Hedging a long position in one and a short in the other, plays into investors’ decisions. A ratio above 80:1 is generally considered a strong signal that silver is undervalued and it’s a good time to buy, while selling short an equivalent amount of gold, with the aim of gaining a net profit from a comparably better price performance of silver to that of gold.
There are many, highly specific factors that influence the dynamic of the gold-silver ratio, in addition to the more expansive factors mentioned above. These include interest rates (low rates drive up gold prices and high rates drive up silver prices), instability in the equity markets, US Treasury yields, weakness/strength of the US dollar, profitability of mines and the growth of the mining supply, and industrial uses of the metals, particularly silver. For example, silver mining was devastated by the pandemic and many mines closed, amidst an already declining rate of production. This caused an uptick in the sale of silver.
Economically, the current battle against elevated inflation rates, led by the Federal Reserve, means that monetary policy will continue to tighten for the near future. As a result, gold and silver have both experienced selling pressure. However, with interest in green energy again on the rise, the industrial demand for silver is increasing and experts are optimistic about its long-term fundamentals. In fact, some believe its price will increase more than gold’s, percentagewise.
Perhaps the most fundamental factor that influences the gold-silver ratio is supply: the ratio of silver to gold (note the reversal) in the earth’s crust is 17.5:1. Gold is significantly rarer and, by that measure, will always be more valuable. While silver prices tend to rise at a higher rate than gold’s, the difference in availability almost guarantees that they will not surpass them.
There is strong evidence of a stable, long-run relationship between gold and silver prices. Investors can monitor the relationship for hedging against risks. Likewise, economists, political advisers, and historians can add keep an eye on the ratio for indications of trouble ahead or as supporting data for current conditions. The gold-silver ratio is much more substantial assemblage of input than a mere precious metals pricing graph—use it to your advantage!